Using Passenger Flow Data to Optimise Routes, Timetables, and Operating Costs
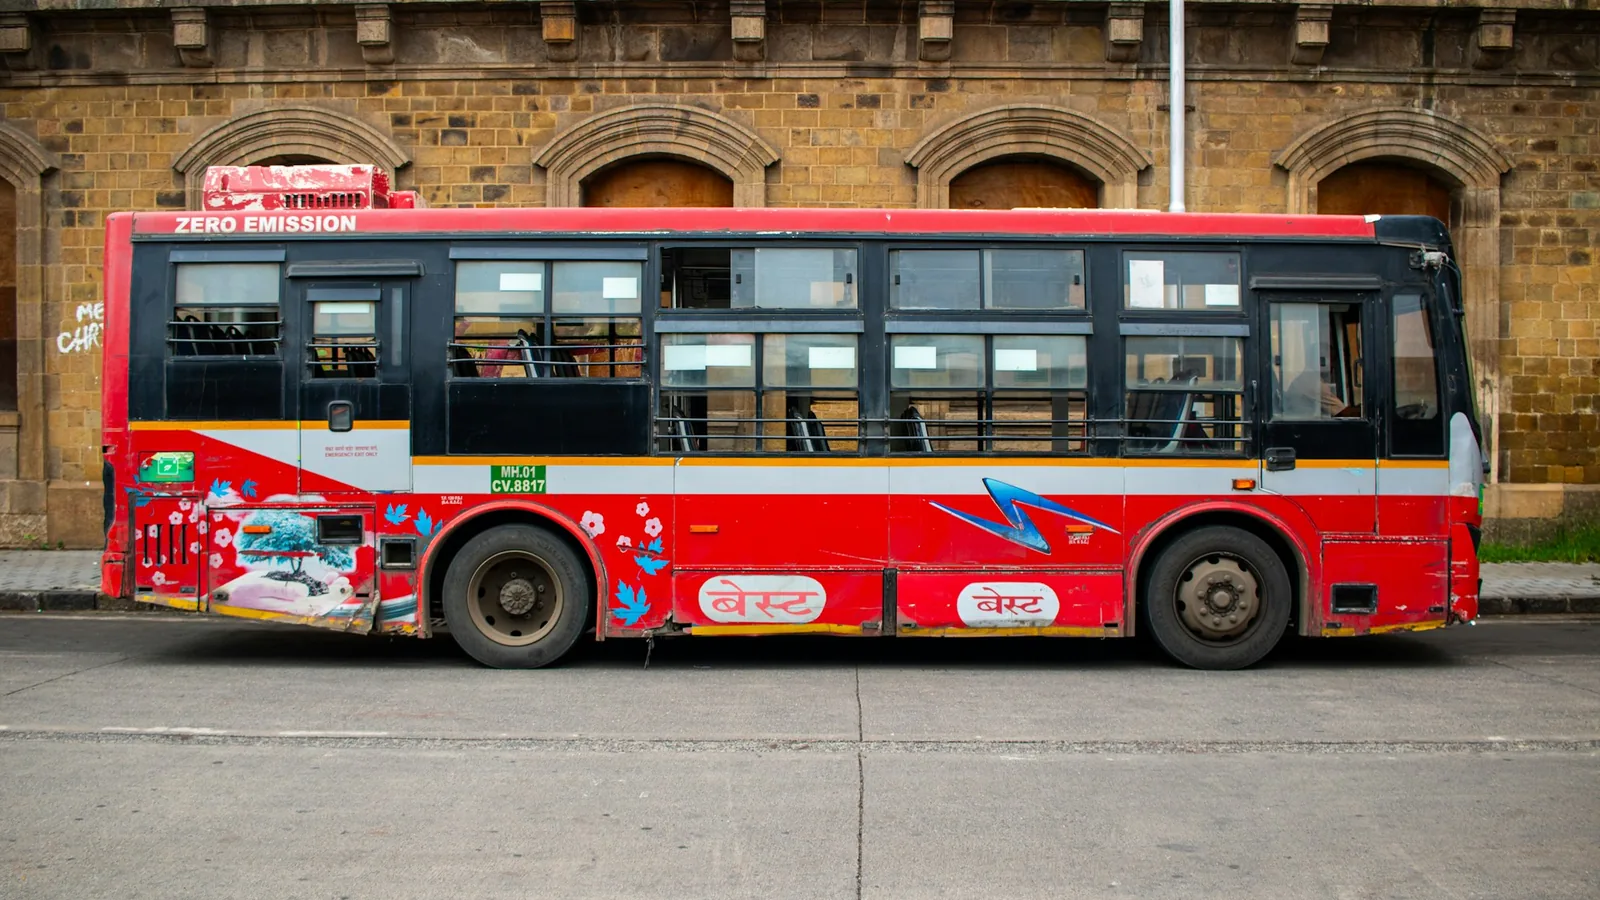
Passenger-flow data shows how demand changes by route, trip, stop, direction, and time of day. Public transport planners can use those patterns to find where service levels and passenger demand are regularly misaligned, then test route or timetable changes against measured use.
Counts alone do not determine the right network plan. They provide a consistent demand record that planners can combine with operating costs, service obligations, vehicle capacity, reliability, and local transport policy.
Build a demand profile for each service
Automatic Passenger Counting (APC) records boardings and alightings throughout a journey. From those movements, operators can see occupancy between stops and identify the busiest sections of a route.
Over time, the data can reveal:
- stops with consistently high or low activity;
- trips that regularly carry high passenger loads;
- route sections where occupancy rises or falls sharply;
- differences between weekdays, weekends, and time periods; and
- changes in demand after a timetable or network adjustment.
This profile is more useful than a route-wide total because demand is rarely distributed evenly across an entire line or operating day.
Review timetables against actual use
A timetable defines when capacity is available. Passenger-flow data shows when people use it.
Planners can compare trips on the same route to find recurring crowding, uneven loads between consecutive services, or low-use departures. That evidence can support a review of departure times, service intervals, or vehicle allocation.
The review should cover a representative period. One busy day or one quiet trip may reflect an event, disruption, school calendar, or data issue rather than a stable pattern. Historical analysis helps separate recurring demand from exceptions.
Support route planning and rationalisation
Boarding and alighting patterns can also inform route studies. High activity at particular stops may show important demand centres or interchange points. Sections with consistently low use may warrant closer review, especially when nearby services overlap.
Route rationalisation is broader than removing low-use kilometres. Planners need to consider access, coverage, transfers, reliability, and the effect on passengers who have fewer alternatives. APC data contributes measured ridership evidence to that decision without replacing those wider requirements.
For new routes, passenger counts from connected services can help establish where demand currently enters and leaves the network. After a route launches, the same measures provide a consistent way to monitor adoption.
Connect service decisions with cost data
Operating-cost analysis requires more than passenger counts. Vehicle hours, distance, staffing, energy or fuel, maintenance, and contractual obligations all affect cost.
Passenger-flow data supplies the demand side of the comparison. When it is joined with operating data, teams can examine cost and usage at the route or trip level. This helps them focus detailed studies on services where the relationship between resources and passenger demand needs attention.
Measure the result of each change
Planning should continue after a new timetable or route pattern is introduced. Comparing passenger flows before and after a change can show whether loads became more balanced, crowding moved to another trip, or passenger use changed at affected stops.
WEBREATHE supports historical ridership analysis, automated reporting, and journey replay for this work. Explore the passenger-counting and analytics platform , or learn how passenger data can improve flow through transit stations .